 Every Voice
Analytics
See how many people came, which languages they used and how each session went.
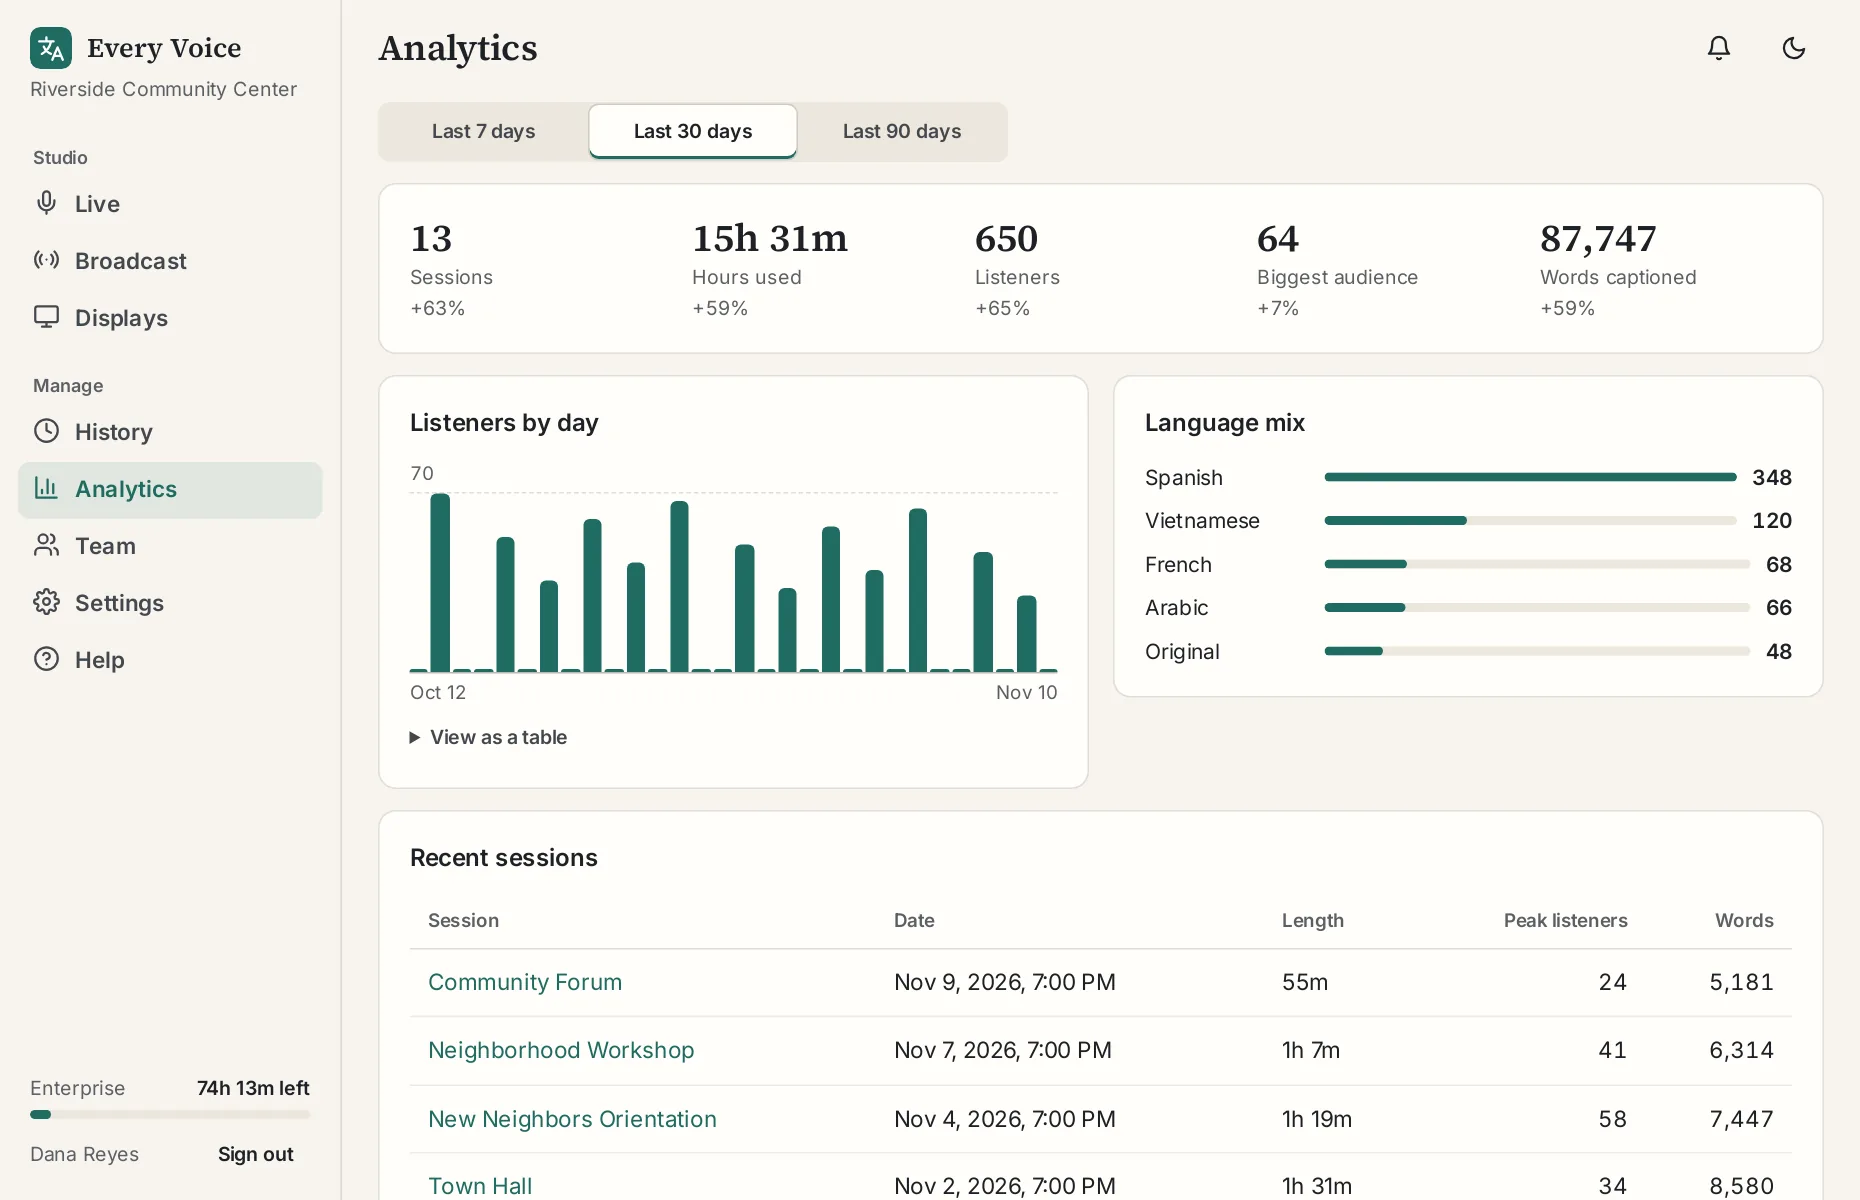
The Analytics page covers the last 7, 30 or 90 days and compares it with the period before.
What's included
| Measure | What it tells you |
|---|---|
| Sessions and hours used | How much you ran |
| Total listeners and biggest audience | How far it reached |
| Words captioned | How much was said |
| Language mix | Which languages people actually chose |
One session in detail
Open a session from History to see listeners over time, how many stayed to the end, whether they were on phones, tablets or computers, and how many used the voice. Session quality shows the time to the first caption, reconnects and the longest silence, which helps when you're working out why an event didn't go well.
Your privacy, and your listeners'
Listener numbers come from a random ID on each device. Names aren't collected. See the privacy page.